Atmosphere
Success Stories
Methane Observing System
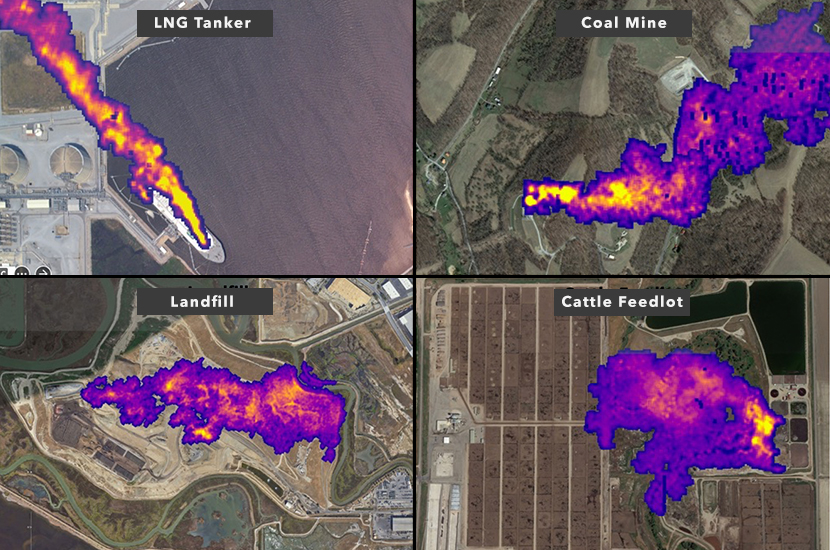
A methane observing system combines Satellite (TROPOMI) regional scale flux inversions with aircraft (GAO and AVIRIS-ng) point source quantification to determine contribution of strong point sources to regional total emissions (Duren CMS2018). The system allows for the mapping of the location and intensity of methane emissions due to petroleum and industrial activity across the United States and is being extended across urban areas and previously unmapped locations globally.
To reduce rapidly growing methane climate forcing, it is critical to identify individual methane emission sources with high potential for mitigation, including those with high volumes from focused locations. The work demonstrates how complementary satellites enable global detection, identification, and monitoring of methane super-emitters at the facility level.
National Methane Inventory
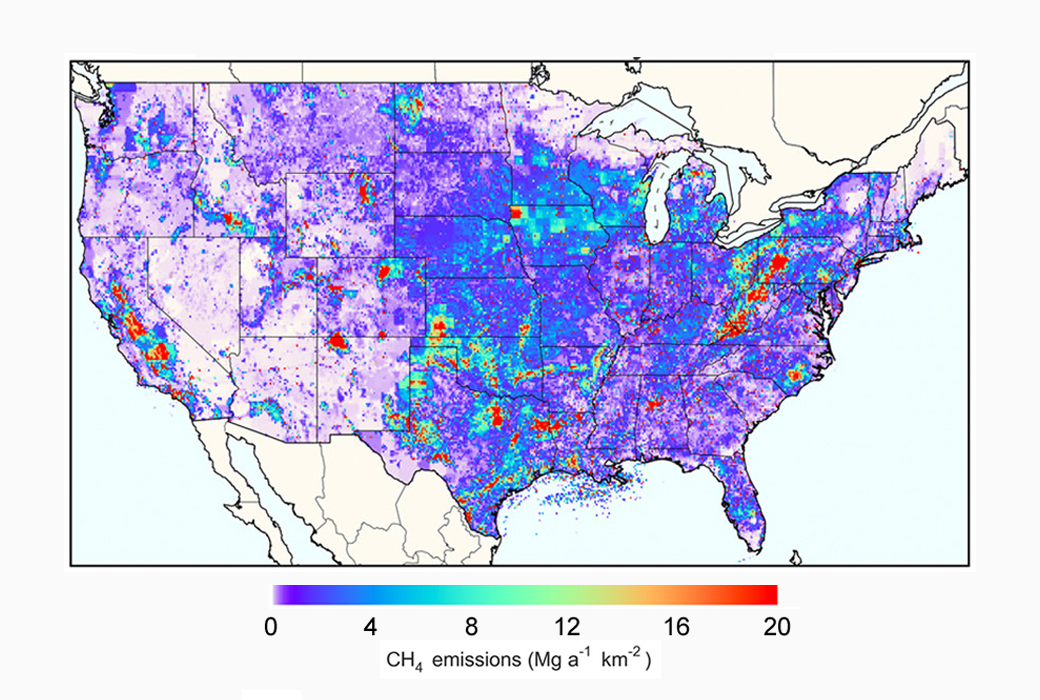
National methane inventory for the United States is mapped using a rigorous inverse top-down analysis to test the national methane emission inventories reported by the agencies to the United Nations. A wide range of databases at the state, county, local, and point source along with satellite remote sensing information and models allows for disaggregation of the inventory and allocation of the spatial and temporal distribution of emissions for individual source types (Sayers CMS2016).
The inventory is designed to be consistent with the US Environmental Protection Agency (EPA) Inventory of US Greenhouse Gas Emissions and Sinks (GHGI). The EPA inventory is available only as national totals for different source types. This new modeling and mapping system provides geographic and temporal specificity needed to identify sources and mitigate emissions through policy.
Carbon Monitoring Datasets

Improved carbon monitoring datasets combine satellite CO2 observations with advanced models and data assimilation systems to create complete information in support of climate policies. This dataset, provided by NASA’s Goddard Earth Observing System (GEOS), uses millions of additional satellite observations related to emissions (nighttime lights, fire radiative power, vegetation greenness) and atmospheric circulation (winds, temperature, pressure) to fill gaps when OCO-2 data are not available (Ott CMS2016).
GEOS also provides additional vertical information that satellites cannot observe, which supports validation and intercomparison with other datasets. The GEOS system is an important tool to build the modeling and observational tools available for the United States. Over the past 10 years, we’ve seen these products grow from ideas into mature datasets with the quality needed to support decision-making at a range of scales.